In 2000, the Space Shuttle completed a mission using radar to map out topography of the earth. This data was released to the world in 2014. We have just added this data to our OsmAnd ATV and Snowmobile Trail map products to take advantage of the new OsmAnd feature that allows elevation and slope graphs to be displayed for any calculated trail route.
The data covers New Hampshire, Vermont, West Virginia and Maine.
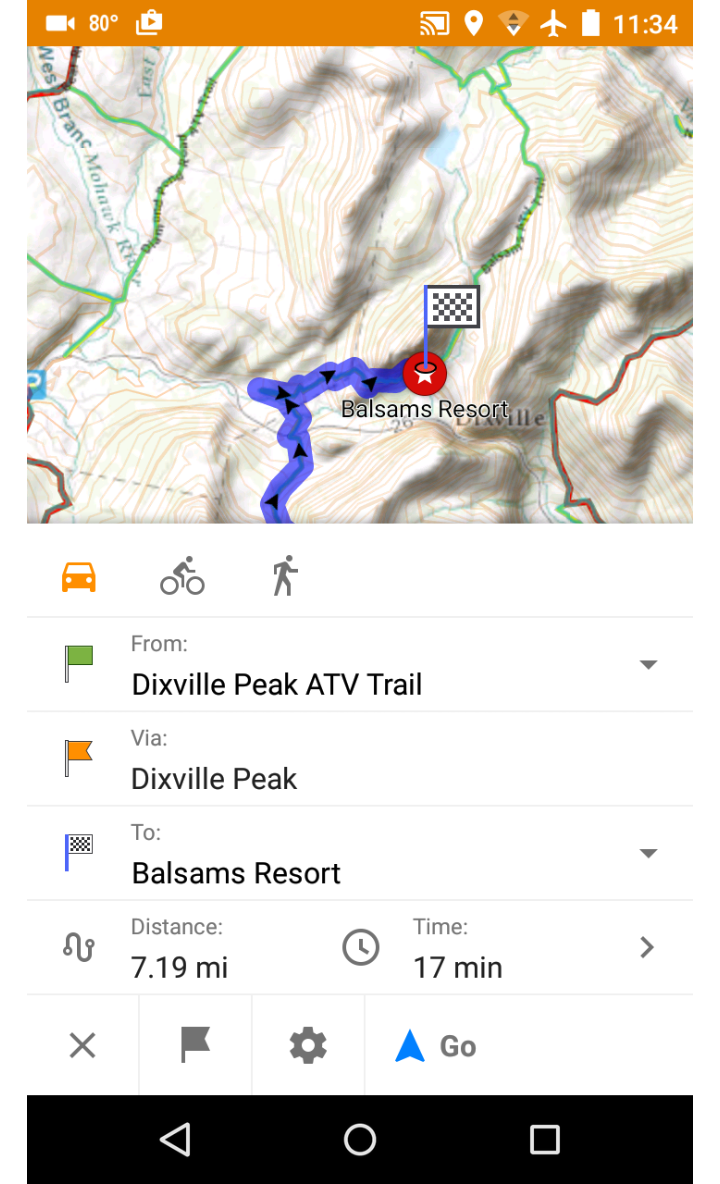
A multi-point route is ic calculated between a point on the Dixville Peak ATV trail, the peak, and then down the northern side to the Balsams Resort. Click on the Distance line to display the Elevation/Slope graph.
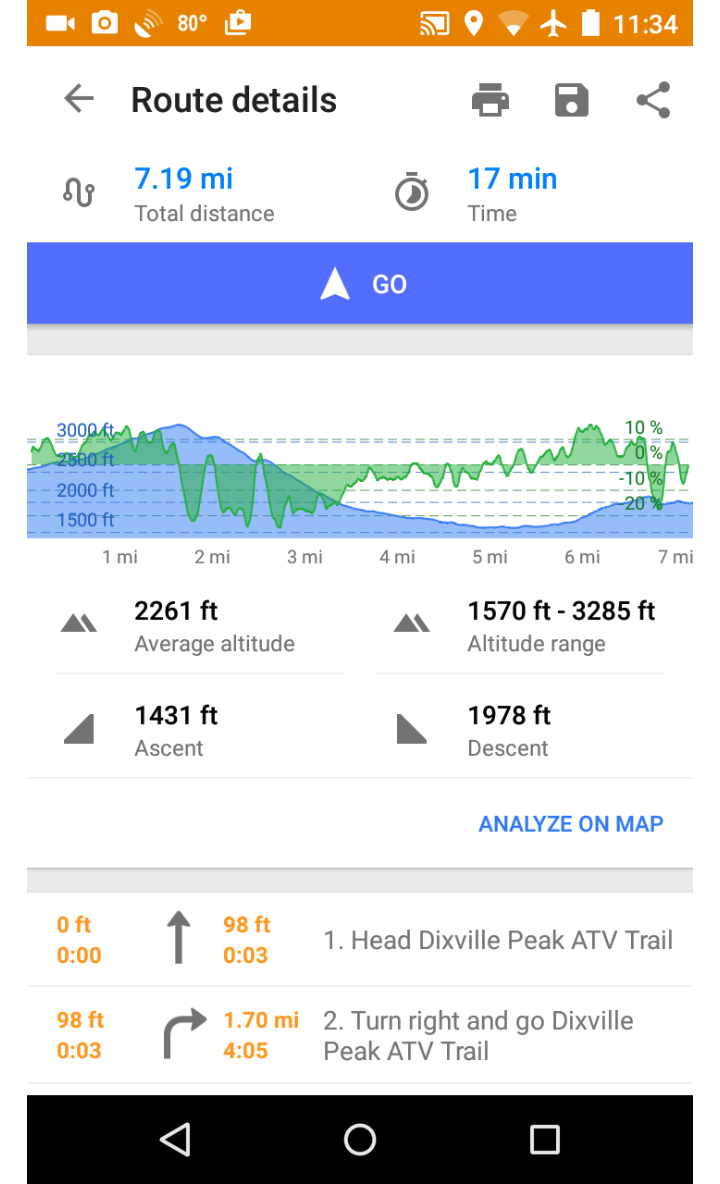
Elevation and slope graph is displayed along the course of the route. Click ANALYZE ON MAP to view graph and map.
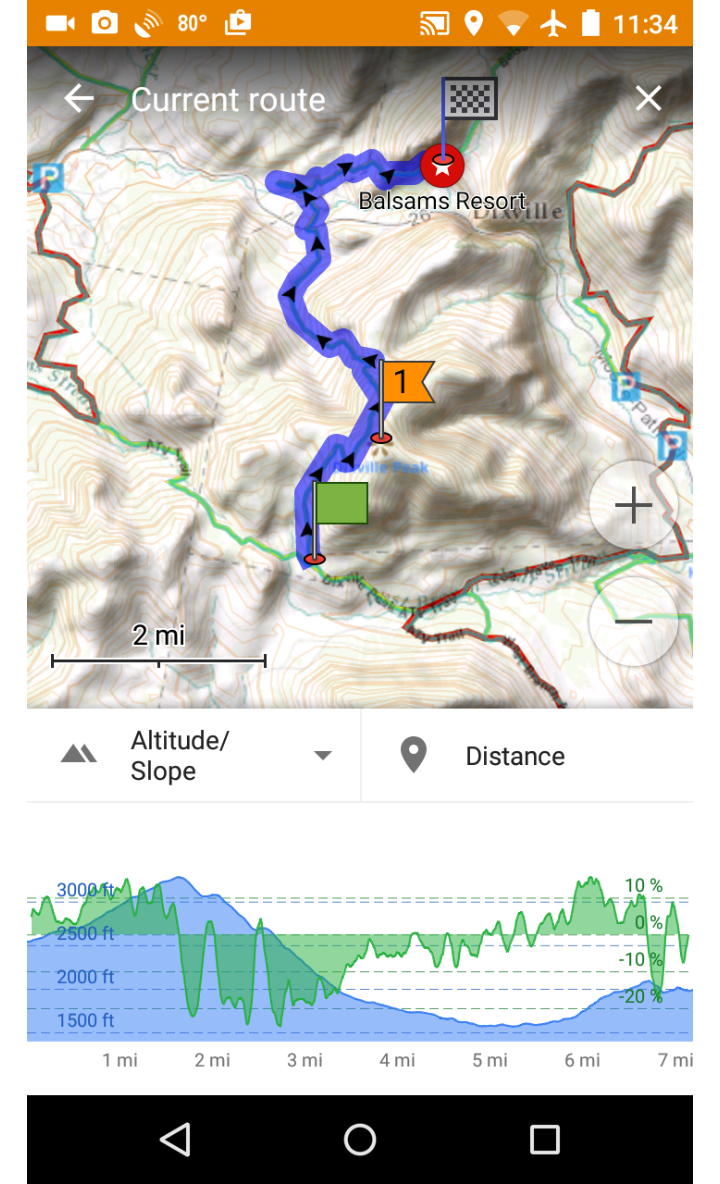
Elevation/Slope graph is displayed with the map of the route.
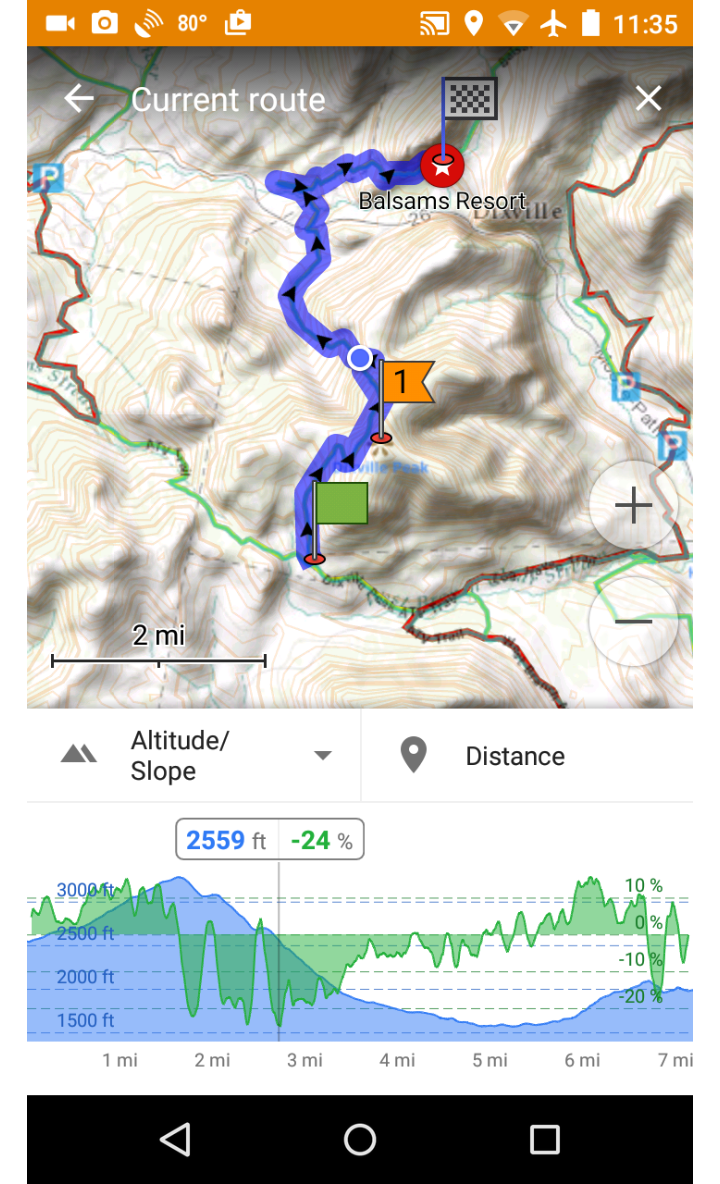
Drag your finger on the graph. Elevation and slope are indicated and a blue dot indicates the position along the route. In this case we have pinpointed the location on the trail with the highest downhill slope. It's the steepest point along the trail with a -24% downward slope.
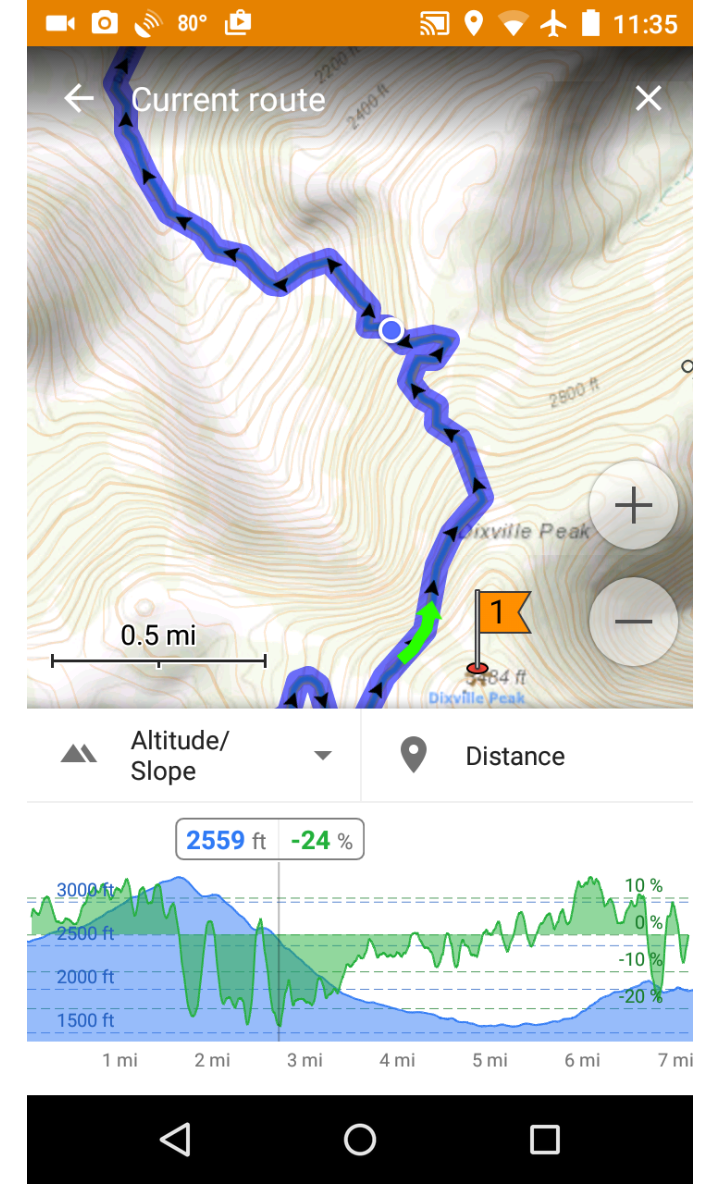
Zooming to the location of the blue dot point of highest slope. We can see from the close proximity of elevation lines on the ERSI Topo map that this is indeed a very steep section of trail!
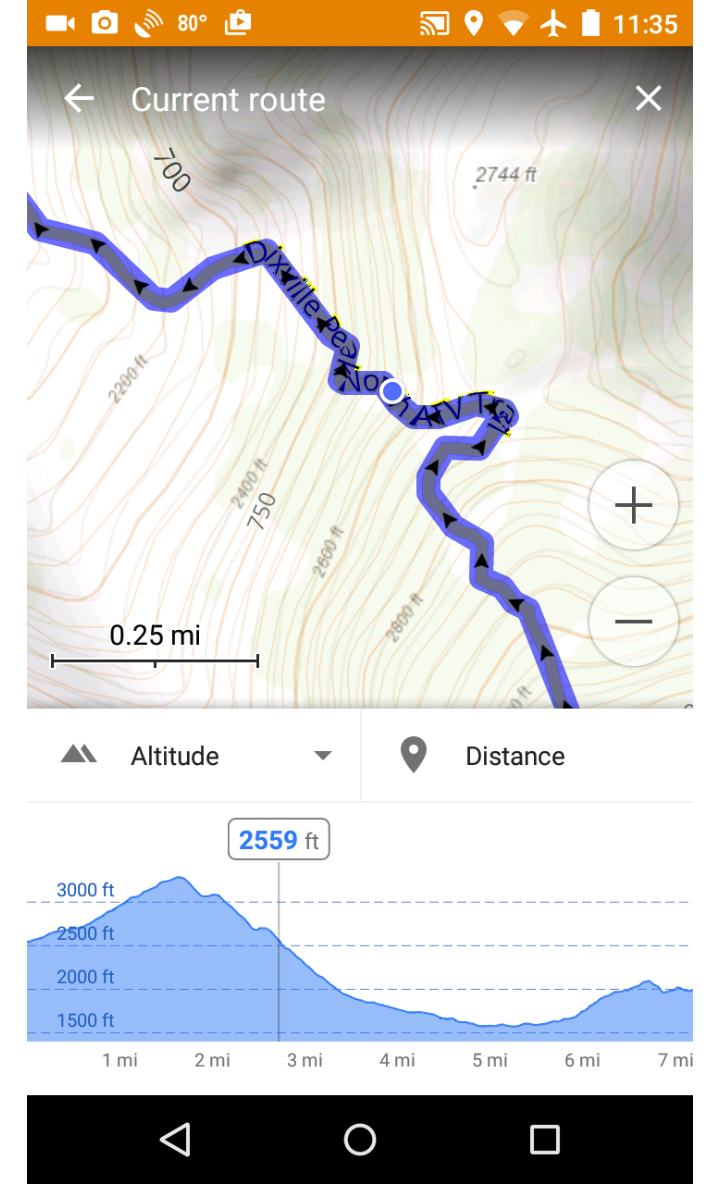
We can simplify the graph to display only the elevation by selecting ALTITUDE from the drop-down.
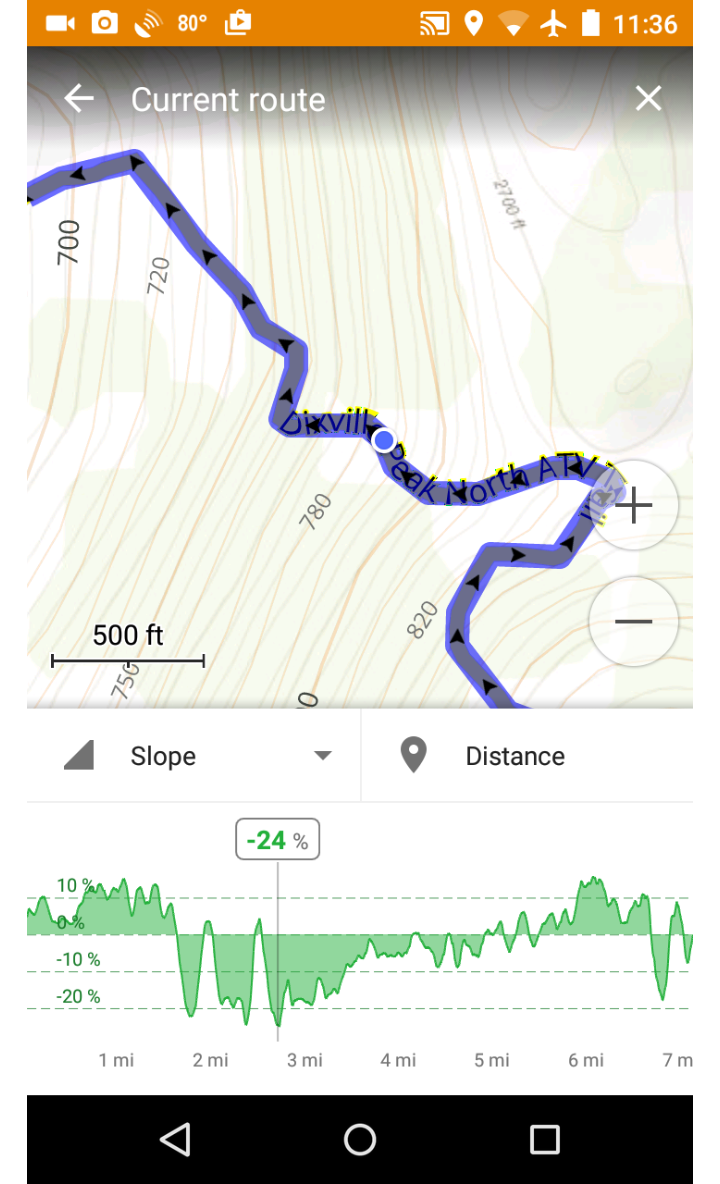
We can also show just Slope using the drop-down.
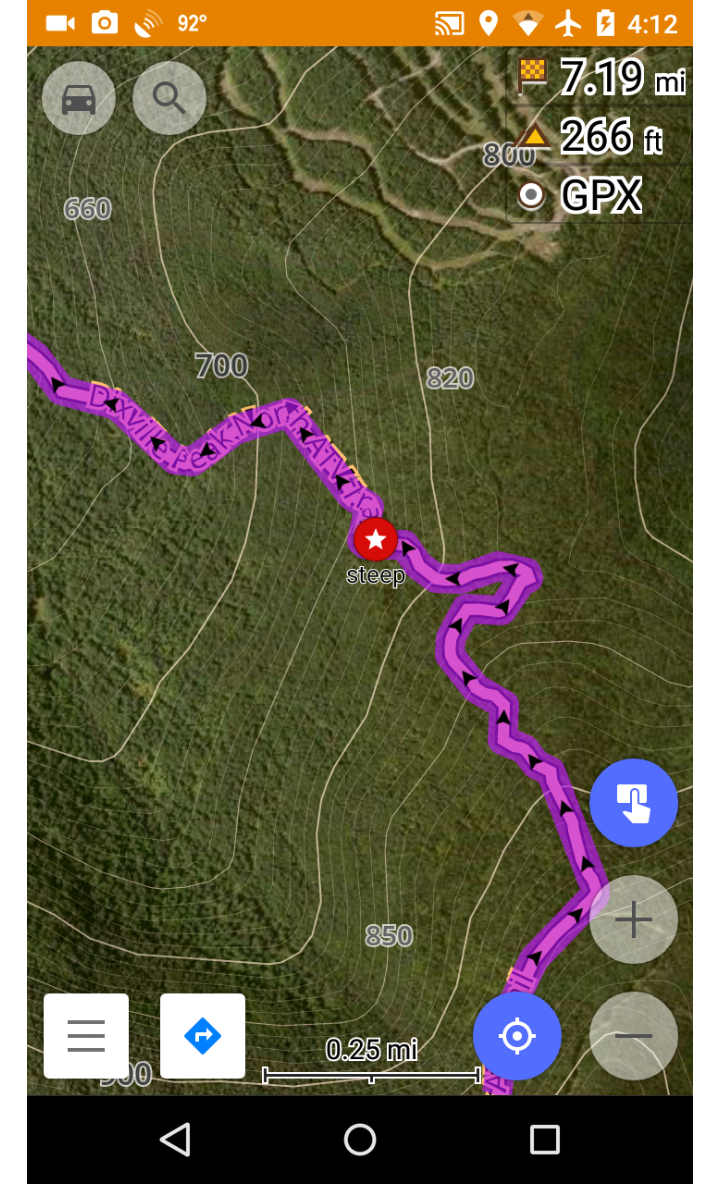
We created a favorite at the steepest spot depicted by a red star icon. We have the map settings to Microsoft Hybrid satellite underlay, with contour lines and the Topo map style.